Microsoft Power BI is a versatile tool that businesses and professionals use daily for data visualization and reporting. While it’s popular among business analysts, it’s designed to be user-friendly for those without specialized data knowledge.
In this article, we’ll explore Power BI’s features, how modern businesses use it, and the professionals who typically work with it. We’ll also discuss alternative tools and online resources to help you get started with this essential business intelligence tool.
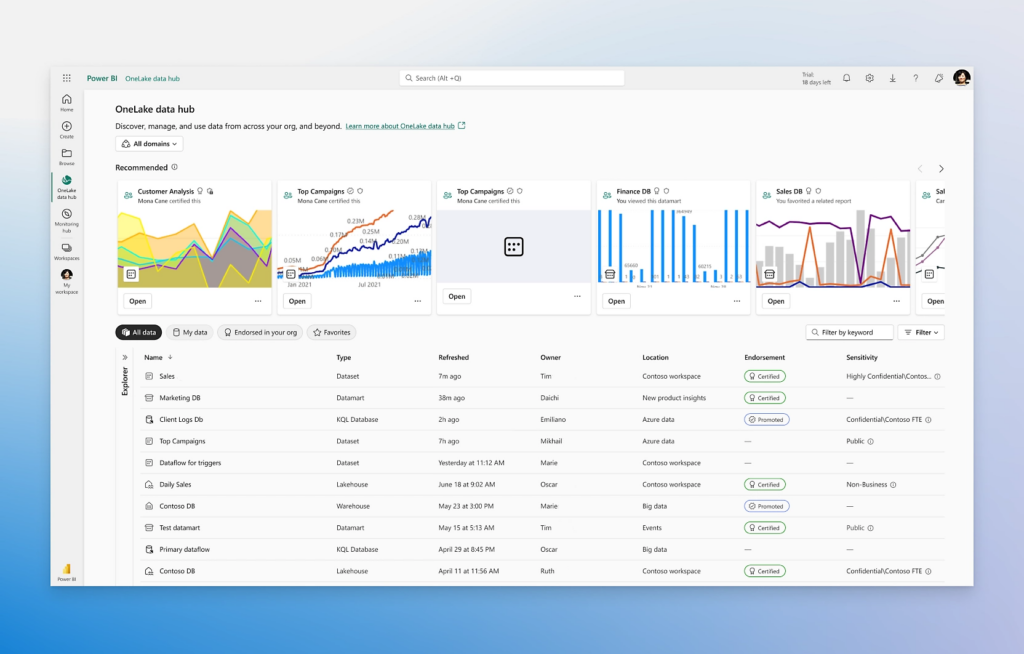
What is Microsoft Power BI?
Microsoft Power BI is a data visualization platform primarily used for business intelligence. It’s like a super-smart tool that helps business folks understand and present data in easy-to-grasp ways. You can create all sorts of cool charts, graphs, and maps to make your data come alive.
One neat feature is its “AI Insights,” which uses fancy AI to dig deep into your data and find interesting trends and insights. It’s like having a data-savvy assistant right at your fingertips!
Power BI comes in different flavors like Power BI Desktop, Pro, Premium, Mobile, Embedded, and Report Server. Some are free, but the Pro and Premium versions offer more advanced features for serious data crunching.
And here’s a fun fact: Power BI is part of Microsoft’s Power Platform, which includes other cool tools like Power Apps, Power Pages, Power Automate, and Power Virtual Agents. These tools help businesses analyze data, create solutions, automate tasks, and even build chatbots without needing to be a coding whiz. Cool, right?
What is Power BI used for?
Whether you’re a data pro or are just entering the business world, Power BI is designed to empower you with data-driven insights. Some of the most common uses for the platform include:
- Creating reports and dashboards that present data sets in multiple ways using visuals.
- Connecting various data sources, such as Excel sheets, onsite data warehouses, and cloud-based data storage, and then transforming them into business insights
- Turning data into a wide range of different visuals, including pie charts, decomposition trees, gauge charts, KPIs, combo charts, bar and column charts, and ribbon charts – among many other options
- Providing company-wide access to data, data visualization tools, and insights in order to create a data-driven work culture
Who should use Power BI?
Power BI users aren’t limited to data professionals, such as data scientists or data engineers, and can include a wide range of different business users.
In fact, the platform is intentionally designed so non-technical users can easily create reports, manipulate data, and perform in-depth data analysis operations.
Nonetheless, some of the most common analyst positions that use the platform on a daily basis include the following:
- Business analysts
- Business intelligence analysts
- Supply chain analysts
- Data analyst
What are the real-world applications of Power BI?
In today’s data-driven world, tools like Power BI play a crucial role in transforming raw data into actionable insights. Businesses across industries are leveraging these platforms to gain valuable insights, create reports, and visualize data in interactive ways.
For instance, imagine a university aiming to enhance the efficiency of its buildings. By setting up a system to collect real-time data on critical building systems (like a digital twin), they can use Power BI to analyze this data and pinpoint areas for improvement, such as energy usage or maintenance scheduling.
Similarly, an advertising company running a digital marketing campaign can benefit from Power BI. By connecting various data sources, they can create a dashboard that highlights key metrics, helping them understand which marketing channels are most effective in reaching their target audience.
In both cases, Power BI enables organizations to make informed decisions based on data, ultimately leading to improved efficiency, effectiveness, and performance.

Reasons to use Power BI
There are several compelling reasons why organizations choose to adopt it for their data analysis needs:
1- Accessibility to datasets from various sources
Power BI allows organizations to access and analyze large volumes of data from diverse sources such as Microsoft Excel, XML, CSV, JSON, and PDF.
It enables users to view, analyze, and visualize massive datasets that may be too large for Microsoft Excel to handle efficiently. The service also employs compression algorithms to import and cache extracted data into a .PBIX file, ensuring efficient data handling.
2- Interactive UI/UX features
It provides a user-friendly interface with interactive features, making business processes visually appealing and easier to understand.
Users can easily drag and drop components within the workspace and copy necessary formatting across different visualizations, enhancing user experience and productivity.
3- Exceptional software integration with Excel
Power BI seamlessly integrates with Microsoft Excel, allowing users to gather, analyze, publish, and share business data with stakeholders and team members. Users familiar with Microsoft Office 365 can connect their queries, data models, and reports from Excel to their dashboards, streamlining the data analysis process.
4- Accelerated Big Data preparation with Azure
The tool uses Azure Data Lake service to analyze and share large volumes of data quickly. This reduces the time required to retrieve data-driven insights and improves collaboration among Business Analysts, Data Engineers, and Data Scientists.
The Data Lake simplifies data ingestion and storage complexities, enabling faster batch, streaming, and interactive data analytics.
5- Transform insights into action
It enables organizations to translate data-driven insights into actionable strategies, helping them make informed business decisions. By leveraging data analytics, organizations can develop successful business strategies and optimize their operations for better outcomes.
6- Stream analytics for real-time data
The visualization tool offers real-time data stream analytics, allowing users to extract data from various sensors and social media sources in real-time. This capability enhances decision-making processes, enabling organizations to optimize their business outcomes based on up-to-date information.

What are the key features of Power BI?
Power BI offers a range of features designed to enhance data analysis and visualization capabilities:
- Power BI Desktop: Users can download and install Power BI Desktop for free, allowing them to design reports and access data seamlessly. No advanced report design or querying skills are required to create reports.
- Stream Analytics: This tool supports real-time streaming analytics, enabling users to analyze data from various sources such as factory sensors and social media in real-time. This feature helps users make informed decisions quickly.
- Multiple Data Sources: It provides support for a wide range of data sources, including CSV, Excel, Microsoft SQL Server, and web files. This native integration allows users to create interactive visualizations and eliminate data silos within their organization. The software also offers an on-premises data gateway for merging cloud and on-premises data sources in the same query.
- Custom Visualization: For complex datasets that may not be adequately represented by standard BI visualizations, users can access a library of customizable visualizations. This library includes open-source tools and supports popular JavaScript libraries like jQuery, D3, and scripts written in the R language, allowing users to create tailored visualizations to meet their business needs.

Advantages and disadvantages
Here are some advantages and disadvantages of Power BI:
| Advantages | Disadvantages |
| Power BI is relatively inexpensive. | DAX language can be rigid and awkward for complex calculations. |
| Offers a wide range of customizable visualizations. | Can struggle with managing data with complex relationships between tables. |
| Allows users to save data to Excel. | Can feel cluttered, with limited usability of tooltips. |
| Provides seamless access to data sources. | Limitations on downloading data, with a maximum of 150,000 rows. |
| Microsoft provides regular updates. | Desktop version is not compatible with Mac/iOS. |
Career Opportunities in Power BI
As business operations become more complex with increased user bases and data generation. Interestingly, companies are turning to Business Intelligence tools for real-time data visualization and improved decision-making.
Microsoft Power BI, as a pioneer in business analytics, is now the preferred choice for many large corporations and businesses. Given the relatively new technology, there is a significant demand for qualified BI Analysts. This makes it an opportune time to start or transition your career in business intelligence.
With a strong understanding of Power BI and related terminology, you can pursue various job roles, including:
Power BI Developer
A Power BI Developer is responsible for developing, designing, and maintaining Business Intelligence solutions. They create and enhance technical documentation based on business requirements.
These professionals have extensive knowledge of Business Intelligence systems and are skilled at resolving user queries. They have a deep understanding of operating systems, networking, databases, cloud architecture, and Business Intelligence concepts.
BI Analyst
A Business Intelligence Analyst gathers corporate data using methods like data mining and analyzes current trends to visualize the company’s competitive position in the market.
They also explore new capabilities in the latest Power BI releases to identify potential benefits for the company. The BI Analyst creates reports based on customer requirements to aid decision-makers in making informed decisions and improving the company’s profitability.
Power BI Consultant
A Power BI consultant evaluates current setups and installs new systems as needed. They develop high-level plans and roadmaps to achieve objectives, balancing client requirements with technical constraints.
BI Manager
Business Intelligence Managers are seasoned professionals with experience as Power BI Developers or BI Analysts. They oversee the BI team’s operations and direct the data strategy.

What are the Power BI Alternatives?
While Microsoft’s BI is one of the most popular business intelligence platforms, it’s not the only one out there. As you’re exploring BI solutions for your workplace or future career, then, you might also consider exploring some common alternatives to Power BI, such as:
Conclusion
After reading this post, you should now have a better understanding of the importance of this tool in business intelligence, its features, and its architecture.
It allows even non-technical users to create interactive dashboards, perform complex analyses, and generate live reports. All in all, it is a valuable tool for businesses seeking to leverage their data for better decision-making. So, if you want to learn Power BI in 2024, our data science bootcamp