From Data Chaos to Visual Clarity
By Rabail Inshra Cheema | 12th June 2023

The key to unlocking data’s hidden treasures is now in your hands! To be specific, on your computer, in a program called Microsoft Excel. Have you guessed it yet?
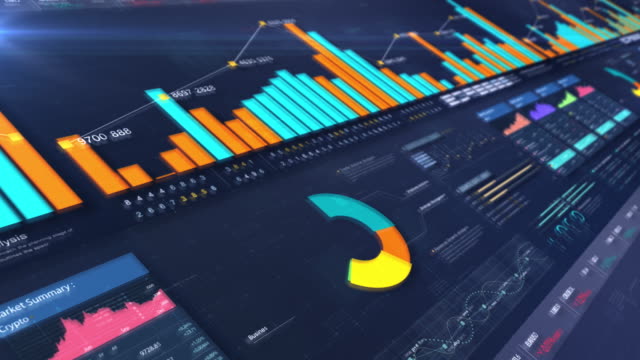
Excel dashboard- the game-changer of data visualisation. Excel dashboards play a pivotal role in modern data visualisation and analysis, making them of utmost importance in today’s digital landscape. It is their versatility, usability, and ability to transform raw data into actionable insights that make them such valuable assets in the data-driven world.
Excel dashboards provide visually captivating representations of complex information, empowering users to uncover valuable insights. These insights drive informed decision-making, leading to improved business outcomes and a distinct competitive advantage.
What Makes An Effective Dashboard?
An effective Excel dashboard integrates relevant metrics, visually appealing charts, interactive filters, and clear data summaries to facilitate data visualization and analysis. When creating an Excel dashboard, two important considerations are defining its purpose and identifying the target audience. Clearly defining the purpose helps in determining what specific insights or information the dashboard should provide. Consider who will be using the dashboard and what their needs, preferences, and level of expertise are. By aligning the purpose with the audience’s needs, you can create a user-centric and interactive Excel dashboard that delivers the right insights to the right people.
Building Your Dashboard
To build your Excel dashboard into a dynamic and insightful tool for data visualisation and analysis, utilize functions and formulas for calculations and analysis. You can add interactive elements like drop-down menus and slicers. Presentation of data is more effective when conditional formatting and visual elements are used.
Optimizing Your Dashboard
To optimize your Excel dashboard, focus on improving performance and efficiency. This includes optimizing formulas and reducing file size. Make sure to protect your data by setting appropriate permissions and passwords. It is important to regularly update and maintain the dashboard to ensure accuracy and relevance.
Excel Dashboard Excellence
Streamlining your data insights is a crucial step and this can be achieved by incorporating the practices given.
1. Simplify for Impact:
We understand that going over the board looks stunning, but the impact lies in simplicity. Make sure to remove unnecessary elements, and create a visually appealing layout that highlights key insights. This will enhance the impact and usability of your Excel dashboard.
2. Data Accuracy Matters
Using data validation, error checking, and data source management, you can build trustworthy dashboards from accurate and reliable data.
3. Testing and Validating Your Excel Dashboard
Find out how to ensure functionality, data accuracy, and ease of use. In this way, your Excel dashboard can perform optimally and deliver reliable insights for effective decision-making.
Excel dashboards truly unleash the power of data visualization and analysis. They provide a platform for users to dive deep into their data, uncovering valuable insights that drive informed decision-making. By embracing the possibilities offered by Excel dashboards, businesses can gain a competitive advantage and succeed in today’s data-driven world.


